How to Measure the Success of Event Entertainment
Stop guessing whether your entertainment was worth it. These KPIs, metrics, and measurement frameworks give you hard data on entertainment ROI for corporate events.
You spent $8,000 on entertainment for the company gala. The CEO loved it. The dance floor was packed. People said it was "great." But when the CFO asks whether that $8,000 was worth it compared to the $3,000 DJ from last year, "great" doesn't hold up in a budget meeting.
The event entertainment industry has historically been terrible at measurement. Success was defined by vibes. But in an era where every marketing dollar requires justification and every experience needs metrics, entertainment ROI can and should be measured with the same rigor as any other business investment.
The Entertainment Measurement Framework
We've developed a framework based on five measurable dimensions. Each dimension captures a different aspect of entertainment value, and together they give a comprehensive picture of ROI.
1. Participation Rate
The most direct measure of entertainment success: what percentage of guests actively engaged? This includes dance floor participation, song request submissions, audience sing-alongs, and any other active participation metric.
How to measure: For events with interactive technology, platform analytics provide exact numbers. For traditional formats, designate someone to estimate dance floor counts at 30-minute intervals. Compare against total attendance.
Participation benchmarks:
- Below 30%: Entertainment isn't connecting with the audience
- 30-50%: Average performance, typical for standard DJ or band
- 50-70%: Strong engagement, indicates good entertainment-audience match
- 70%+: Exceptional — typical of interactive entertainment formats
2. Stay Duration
How long did guests stay after the entertainment began? This metric directly correlates with how compelling the entertainment is. If people are leaving early, the entertainment isn't holding them.
How to measure: Track the time between entertainment start and when the room reaches 50% of peak capacity. Alternatively, use entry/exit counts at 30-minute intervals. Compare against your event's scheduled end time.
3. Post-Event Satisfaction
A brief digital survey sent within 48 hours captures satisfaction while memories are fresh. Key questions:
- On a scale of 1-10, how would you rate the entertainment?
- What was the highlight of the evening? (open-ended)
- Would you attend a similar event next year? (Yes/No)
- How likely are you to recommend this event to a colleague? (NPS scale)
4. Social Media Amplification
Count the number of social media posts, stories, and tags generated during and immediately after the event. This metric has dual value: it measures guest enthusiasm and quantifies the marketing reach of your event.
How to measure: Track event-specific hashtags, geotagged posts from the venue, and direct brand mentions. Tools like Sprout Social, Brandwatch, or even manual Instagram/LinkedIn searches work. Calculate posts per 100 guests to normalize across event sizes.
5. Behavioral Indicators
Indirect metrics that correlate with entertainment quality:
- Bar revenue during entertainment hours — Higher revenue often correlates with longer stays and higher energy
- Photo booth usage — Peaks during high-energy entertainment moments
- Next-year registration rate — For annual events, strong entertainment is the top predictor of return attendance
- Employee satisfaction survey lift — Measure company satisfaction scores before and after major events
Building a Measurement Culture
The first time you measure entertainment ROI, you're establishing a baseline. The real value comes from comparative data across multiple events. Track the same metrics consistently and you'll develop a clear picture of what works for your specific audience.
Over time, you'll answer questions like:
- Does a live band deliver measurably better engagement than a DJ for our team?
- What's the optimal entertainment start time for our demographic?
- Which genres produce the highest participation rates?
- Is the premium for interactive technology justified by engagement improvements?
The Data Advantage of Interactive Entertainment
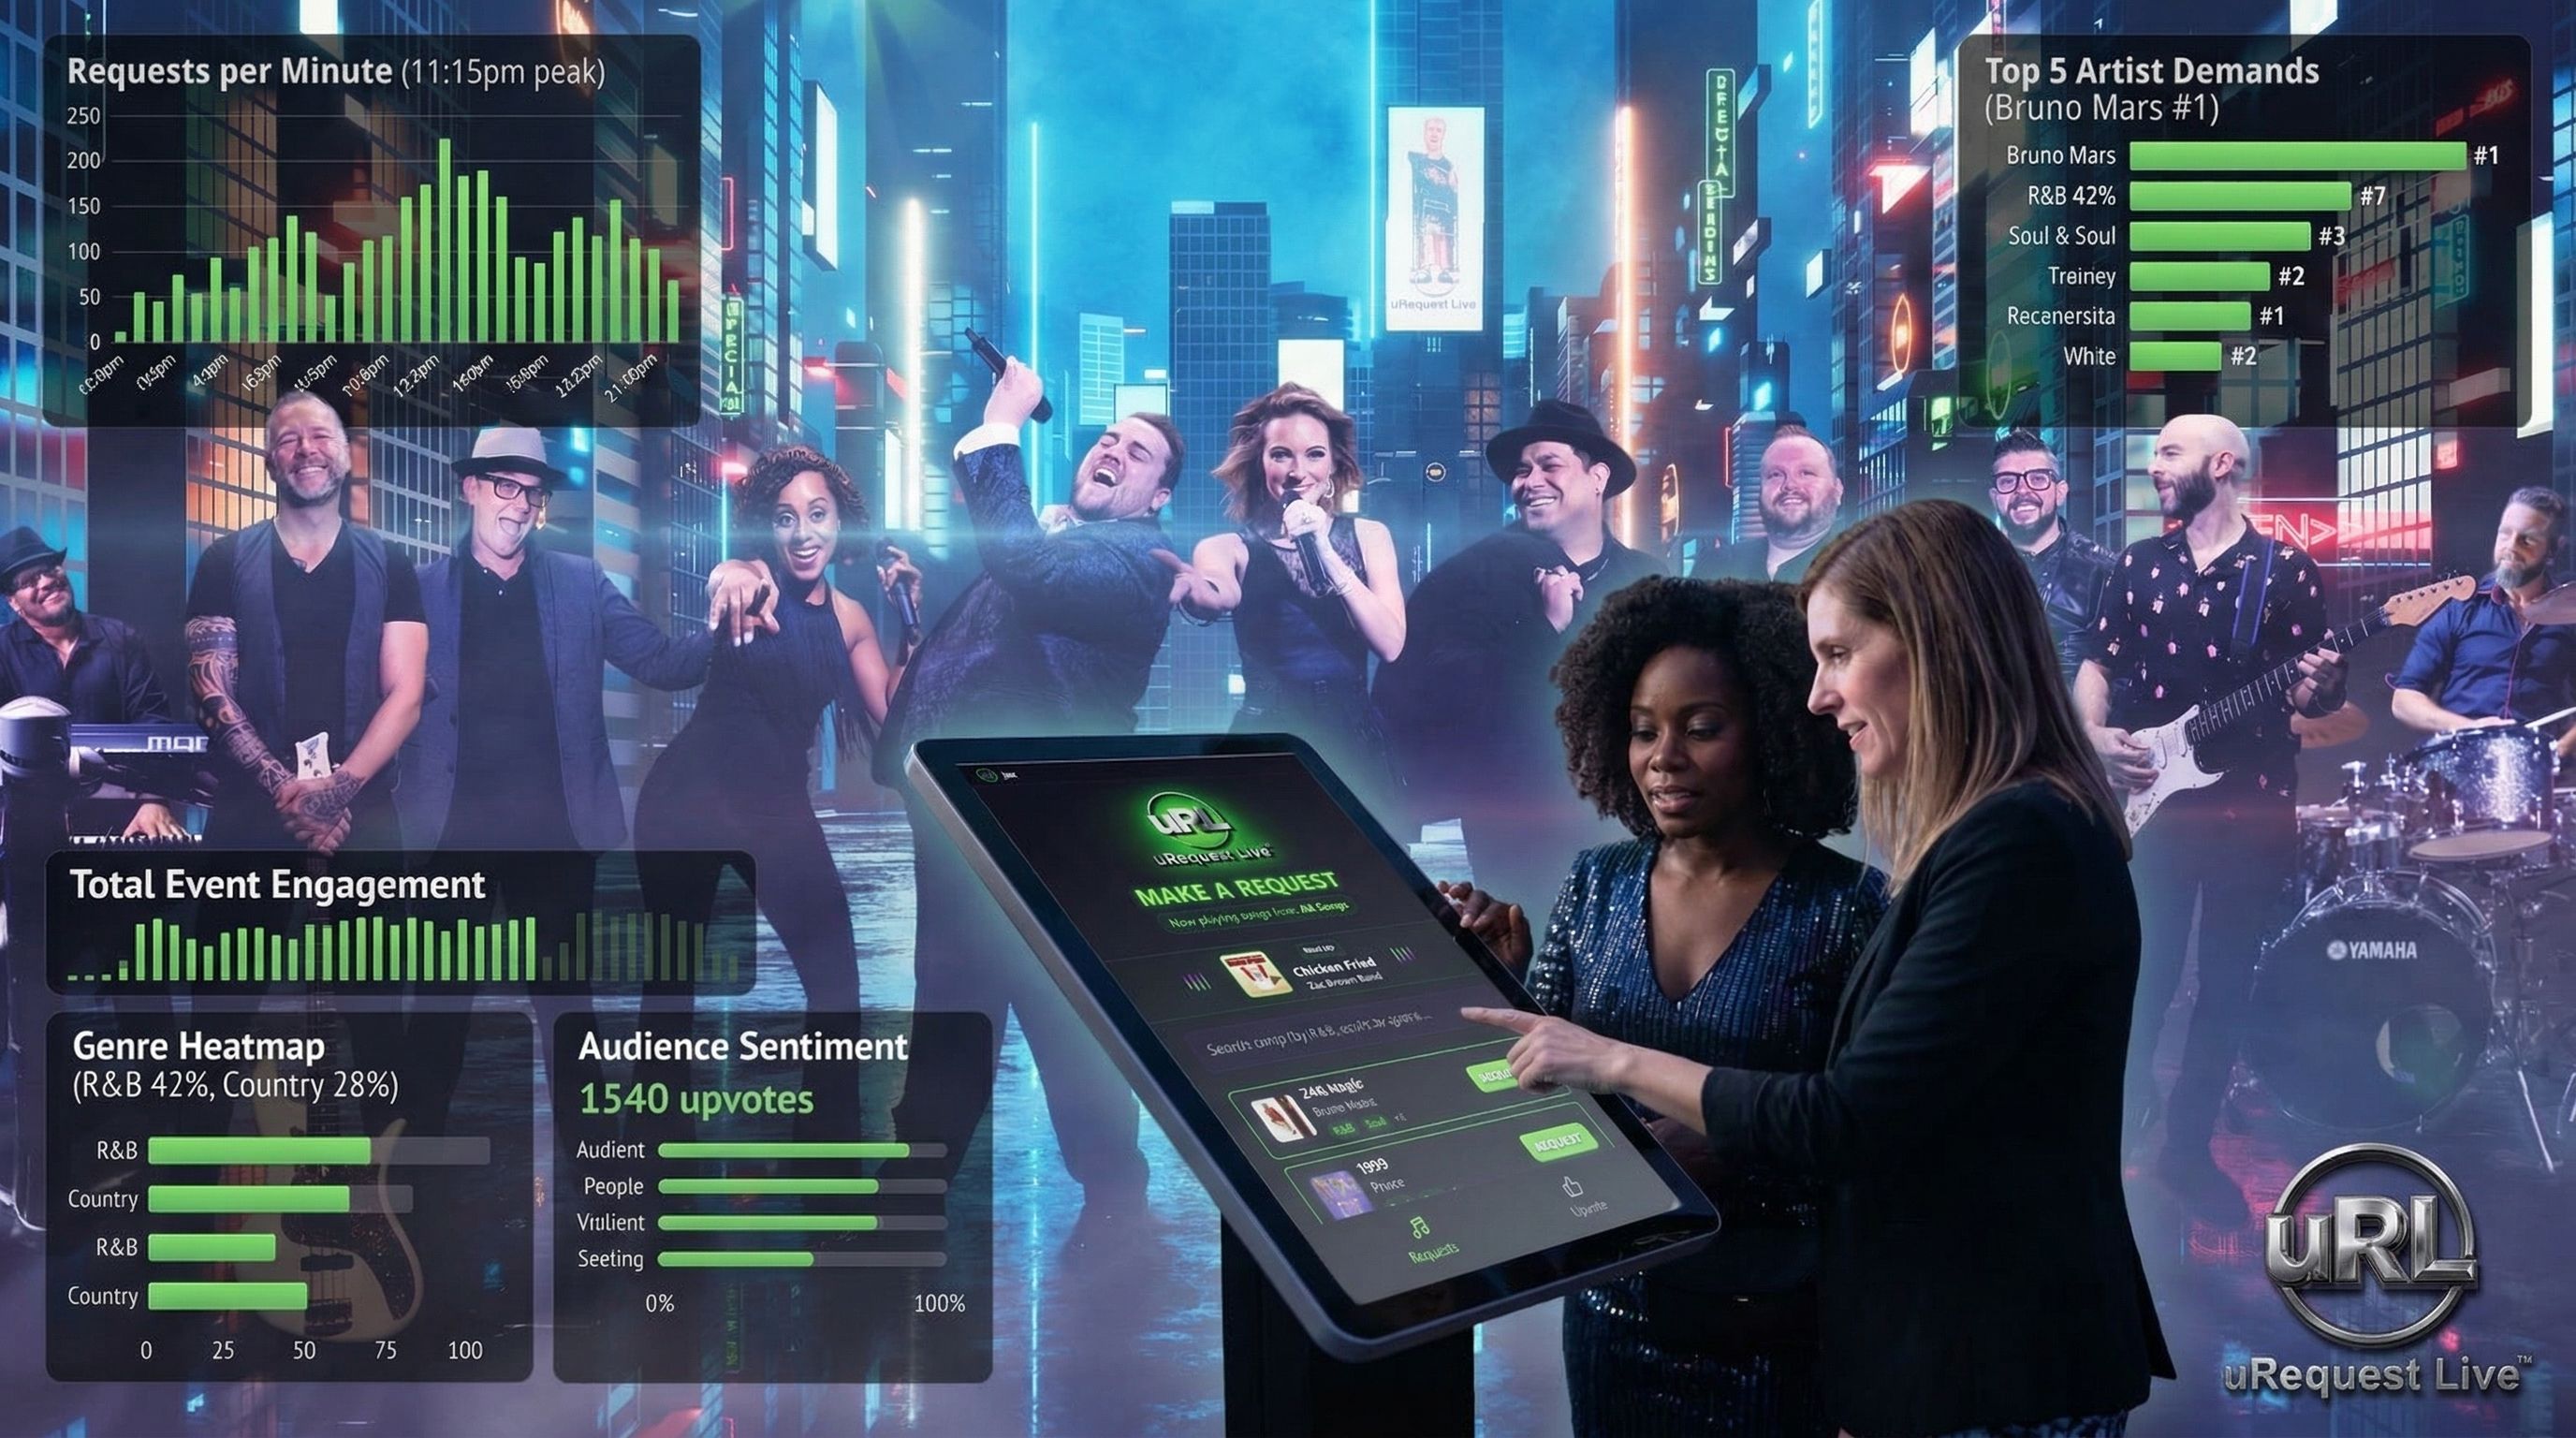
One significant advantage of interactive entertainment platforms is built-in analytics. When guests use a song request system, every interaction generates data: what they searched for, what they voted for, when they were most active, and what genres resonated with different segments of the audience.
This data doesn't just measure the current event — it informs future events. If your analytics show that 80s music consistently gets the highest participation from your team, that's intelligence you can use when planning next year's celebration, briefing next year's band, or even building team playlists for the office.
Presenting Results to Stakeholders
When reporting entertainment ROI to leadership, frame results in business terms:
- Instead of "the band was great," say "78% active participation rate, up from 42% last year"
- Instead of "people stayed late," say "average stay duration increased 75 minutes, representing X additional networking hours"
- Instead of "lots of social media posts," say "47,000 organic impressions, equivalent to $X in paid media"
- Instead of "the dance floor was packed," say "entertainment satisfaction score of 9.1/10, highest in three years"
Numbers change conversations. When entertainment goes from "the fun part of the budget" to "a measurably impactful investment," budget conversations get much easier.
Get Measurable Entertainment Results
Every uRequest Live event comes with post-event analytics. Real data, not guesswork.
Learn MoreFrequently Asked Questions
How do you measure entertainment ROI?
Track participation rate, stay duration, satisfaction scores, social media activity, and behavioral indicators. Compare across events for meaningful insights.
What KPIs should planners track?
Engagement Rate, NPS, Stay Duration, Social Amplification, Return Intent, and for interactive events: Platform Participation and Peak Engagement Time.
How do you survey guests without being intrusive?
3-5 question digital survey within 48 hours. Brief and mobile-friendly. Average response rates: 35-45%.
What's a good entertainment satisfaction score?
Above 8.0/10 is excellent. Interactive entertainment typically scores 8.5-9.2, while traditional formats average 7.0-8.0.